Usage Dashboard
Updated Jul 21, 2026
Usage & StorageUsage Dashboard
See how much of DataMagik your company is using — documents, storage, API calls, AI, and OCR — all in one place.
Open the Usage Dashboard to monitor your company's activity and quotas at a glance.
What it shows
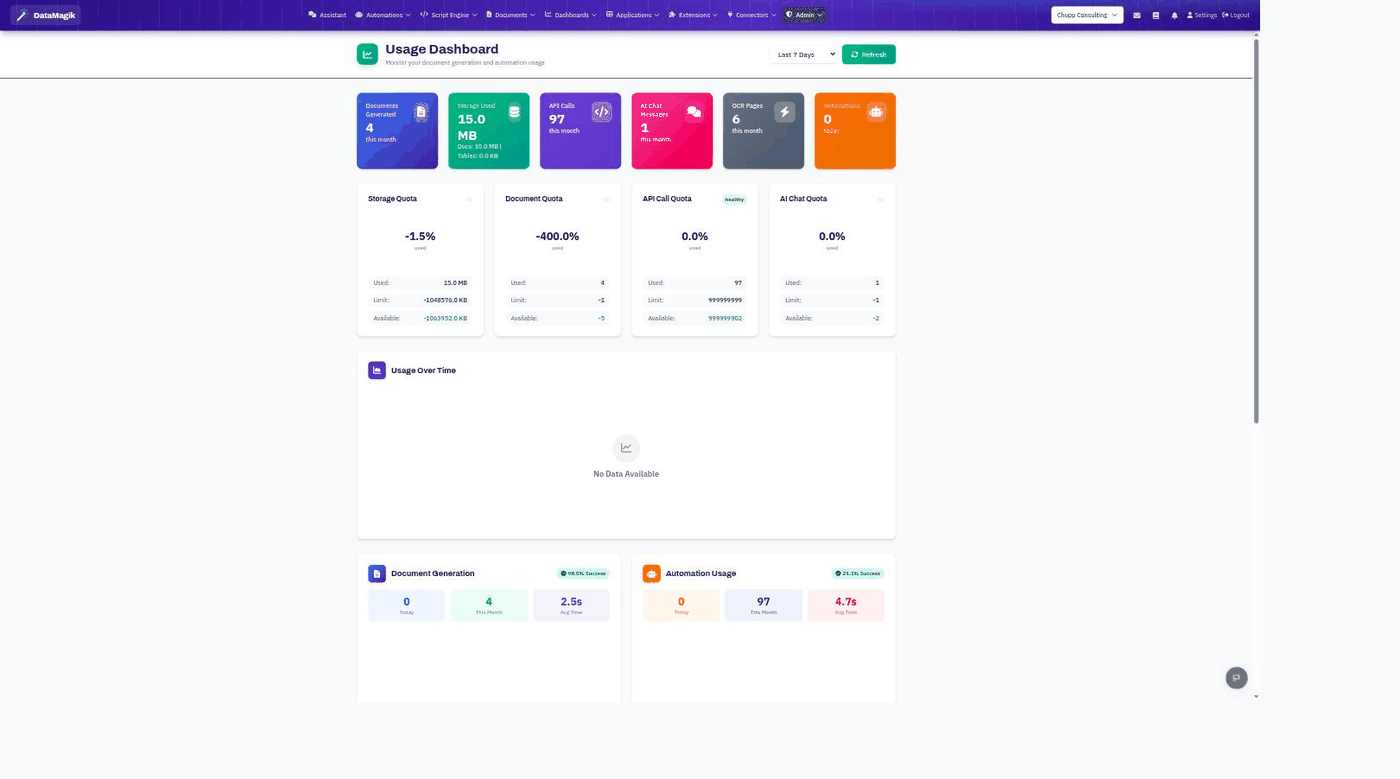
- Summary cards — documents generated, storage used, API calls, AI chat messages, OCR pages, and automations run in the current period.
- Quota cards — how much of each limit (storage, documents, API calls, AI chat) you've used, with a health indicator.
- Usage Over Time — a trend chart of activity across the selected range.
- Document Generation and Automation Usage — counts and success rates with average run times.
Use the time-range selector (for example Last 7 Days) and Refresh to update the view.
Permissions: Viewing the usage dashboard requires the Builder permission.